|
by Dr. Bob Atkins I receive a lot of email asking questions about how to test a lens, how to measure the resolution, what charts to use, how to view the test slides or negatives and so on. This prompted me to put together a small "Lens Testing" package which consists of a pdf file containing the text and graphics (about 12 pages), plus two 8.5"x11" test charts and three 35mm slides (images of a test chart with different lenses). The price of the package is $10 including shipping + handling. The .pdf file can be sent via email or in 3.5" disk. You can contact me at bobatkins@hotmail.com with any questions or for additional ordering information. Note I also have a collection of articles available if you are interested in the technical side of optics and photography. WRITE UP (.pdf file) MTF and resolution - what do they mean?
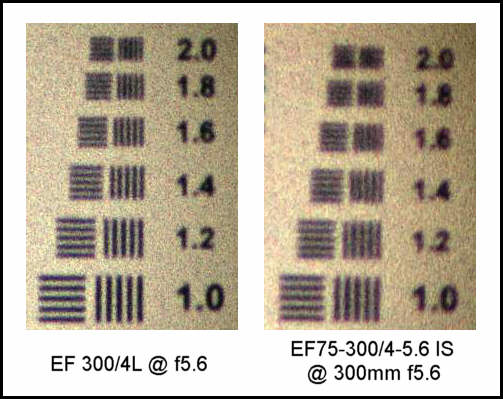
TEST CHART The test chart is a small (8.5" x 11") chart, printed on heavyweight matte paper using a 1440x720 dpi printer. It contains resolution test targets from 0.5 lp/mm to 4 lp/mm. I don't guarantee exact spacing and line widths above about 2 lp/mm though. The chart may be copied and the copy will probably be usable to 2 lp/mm if a good copier is used. There are also gray scale patches for judging exposure and reduced contrast test patterns to show the effects of reduced contrast on resolution. The chart is designed to be cut into 5 or more sections and pasted onto a larger area for lens testing. This isn't the ultimate in test charts, but it's better than shooting images of a newspaper and cheaper than a commercial chart! I recommend the chart from Edmund Scientific for more serious work, but the ones in this package will get you started. If you want to see a large (98K) GIF image of the chart, you can find one here CHART. The real chart is, of course, much higher resolution than this image. The image only gives you an idea of the layout of the chart. The uneven line spacing in the image of the chart is a result of cramming lots of information into a small 98K GIF file. The real chart looks just fine! SAMPLE SLIDES Three sample slides will be included. These are not intended to be reference slides or examples of the ultimate in lens resolution. Rather they are provided as examples for you to look at and study before you do your own tests. My interpretation of the slides is included with the numbers which I measure from them. The current set of slides were shot on Kodachrome 64 using a Canon 300/4L and a Canon 75-300 IS at 75mm and 300mm settings - all shot at f5.6. An example comparison is shown below.
|