Noise & Y-Factor Measurements
Quick Start Guide - EMETest
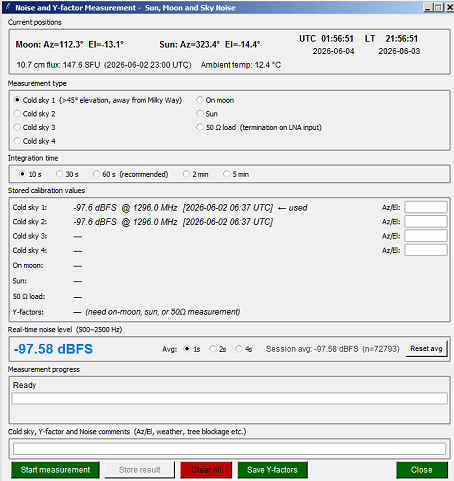
EMETest provides two complementary noise measurement tools: a real-time Noise Monitor for watching noise power as the antenna moves, and a Noise Test function that takes longer averaged measurements from reference sources and computes Y-factors. Both use the 500–2500 Hz audio band, so no additional hardware is needed beyond the sound card already used for echo measurements.
Background: What is a Y-Factor?
A Y-factor is simply the ratio in dB between noise power measured from two different sources. By comparing noise from a known cold (quiet) reference against hotter sources, you can characterise how much noise each source contributes and, indirectly, what the noise figure of the receive system is.
EMETest computes three Y-factors:
| Y-Factor | Formula | What it tells you |
|---|---|---|
| Moon | Pmoon / Pcoldsky | How much the Moon raises the noise floor above cold sky. Useful for correcting echo SNR to a standard Moon distance (perigee) and for estimating antenna beamwidth effects. |
| Sun | Psun / Pcoldsky | A sensitivity diagnostic. The value depends on antenna gain and solar flux; it can be compared with predictions or other stations' results. |
| Ground noise | Pcoldsky / P50 Ω | A direct indicator of receive system noise figure. The higher this value, the better the system noise performance. |
Typical values at 1296 MHz with a 3-metre dish:
- Moon Y-factor: +0.1 to +1 dB
- Sun Y-factor: +10 to +16 dB (depends on solar activity)
- Ground noise: +6 to +8 dB
Using the Noise Monitor
In the Settings panel, set the Noise avg time using the drop-down (0.5 s to 8 s). Shorter periods update faster; longer periods reduce scatter.
Click Noise Mon. The button turns red and readings begin appearing in the Noise level display and on the plot below the SNR history. The plot shows the last 50 readings so short-term trends are visible.
Move the antenna between different sky positions, or switch the LNA input between the antenna and a 50-ohm load, and watch the noise level change. The values are in dBFS (dB relative to full-scale sine wave at 0 dBFS). Typical readings are in the −30 to −59 dBFS range.
Click Stop when done.
Using the Antenna Peaking Plot
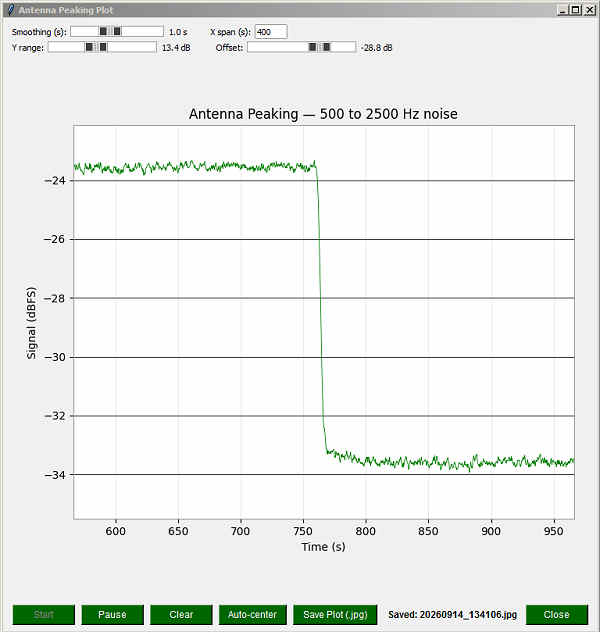
The Peaking Plot window shows noise level vs. time as a scrolling trace, rather than a single numeric reading. It is the tool to reach for any time you need to watch a noise reading rise or fall smoothly while you adjust something — peaking the dish on the Sun or Moon, searching for the quietest patch of cold sky, or watching for a maximum or minimum in noise level during any other procedure. It uses the same 500–2500 Hz noise band as the Noise Monitor and Noise Test.
Open the window
Click Peaking Plot in the Noise Test (Y-factor) window. The plot opens already running, with the trace auto-centred so it is visible immediately.
Watch the trace while you adjust
Slowly sweep the antenna across the source (or across the sky, when looking for a cold-sky minimum) and watch the trace on the plot. A peak indicates maximum noise — the antenna is pointed at the source; a dip indicates a minimum — useful for finding the coldest, quietest sky position. The line updates every 0.25 s, so the response is fast enough to follow small antenna movements.
Smooth out a jittery trace
If the reading fluctuates too much to see a clear peak or dip, increase the Smoothing slider (0 to 2.5 s). This averages out short-term noise fluctuation without slowing the underlying 0.25 s sampling rate, so the display is steadier but still responsive. Set it back toward 0 if you want the fastest possible response instead.
Adjust the display
Use X span to set how many seconds of history are shown before older points scroll off the left edge of the plot. Use the Y range slider (1–30 dB) to set how much of the dB scale is shown, and the Offset slider to move the trace up or down within that range. Click Auto-center at any time to set the offset from the next reading automatically, without resetting the trace or the clock.
Pause, resume, and clear
Click Pause to freeze the trace and stop the clock — useful when you have found a peak or dip and want to study it. Click Start to resume; the clock continues from where it was paused rather than restarting. Click Clear to erase the trace and reset the time axis to zero for a fresh run, keeping the current Y range and offset settings.
Save a record of the plot
Click Save Plot (.jpg) to save the current plot as a
timestamped JPEG image in the noiseplot/ subdirectory of the
data folder — useful for keeping a record of an antenna peaking
procedure or a cold-sky survey.
Using the Noise Test (Y-Factor Measurements)
The Noise Test window takes longer, more accurate measurements from up to four reference sources. Complete the measurements in the order shown; cold sky must be done first as it is the baseline.
Open the Noise Test window
Click the Noise Test button in the main window. The Noise Test window opens showing four measurement slots and a Y-factor results panel.
Cold sky measurement
Point the antenna at a quiet region of sky, well above 45 degrees elevation and away from the Galactic plane. The integration time is set by the Int. time field (default 60 s; longer gives lower uncertainty). Click Measure Cold Sky. When complete, the measured dBFS value appears in the Cold Sky slot.
Up to four cold-sky positions can be measured (slots 1–4). The coldest value is automatically selected as the reference. You can use this to verify that a position is genuinely the quietest part of the sky.
On-Moon measurement
Point the antenna at the Moon and click Measure Moon. The difference from cold sky is the Moon Y-factor. This number can be interpreted in different ways, depending on frequency and dish size. At lower frequencies and with moderate antennas (1296MHz and lower), measured "moon noise" is most likely to be a measure of the sky noise around the moon, plus spillower noise. As such it can be used in the calculation of echo SRN relative to cold sky. At higher frequencies like 10 GHz with dishes 1m or more in diameter, the real thermal emission from the moon can be measured. So some caution is advised when interpreting the meaning of any measured moon-noise Y-factor
Sun measurement
Point the antenna at the Sun and click Measure Sun. Note the current 10.7 cm solar flux value — EMETest can retrieve this automatically from the DRAO Penticton data feed — since solar emission varies and the measured Y-factor cannot be properly interpreted without knowing the flux at the time of measurement.
50-ohm load measurement
Connect a 50-ohm termination to the LNA input (or switch an antenna relay to a load) and click Measure 50 Ω. Note the ambient temperature of the load environment, since the load's thermal noise depends on temperature. An ambient temperature bases on your location is retrieved from the internet if available. This is just an approximate temperature bases on current meteorological data.
Read the Y-factors and save
Y-factors are computed and displayed automatically as measurements are
added. When all desired measurements are complete, optionally add a note in
the Cold sky notes text box (e.g., the azimuth and elevation
of the cold sky position), then click Save Y-factors.
A timestamped text file is saved in the noise/ subdirectory
of the data folder.