EME Batch SNR Analyser
Quick Start Guide — WAV File Reader
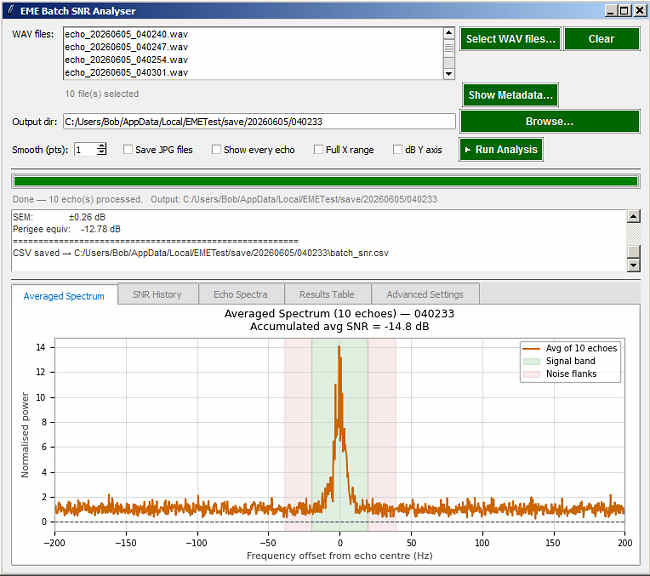
The EME Batch SNR Analyser reads echo WAV recordings saved by EMETest and computes the SNR for each echo using the same algorithm as the live program. No re-entry of parameters is required — all the information needed for analysis is embedded in each WAV file by EMETest at the time of recording.
The Workflow in Brief
Select files → click Run Analysis → view results in the tabbed plots and results table → optionally adjust display settings and export.
Step-by-Step
Select WAV files
Click Select WAV files…. A multi-select file
dialog opens. Navigate to the directory where EMETest saved the session
recordings — typically a dated subdirectory of the EMETest data folder
(e.g., save\2025-06-01_1800\). Select one or more
echo_*.wav files. You can select any subset in any order;
the analyser sorts them internally by filename.
The selected filenames appear in the list box. Click a filename and click Show Metadata… to inspect the parameters embedded in that file.
Check the output directory
The output directory defaults to the folder containing the selected files. If you want results (CSV and JPEG plots) saved elsewhere, click Browse… next to the output path field and choose a different directory.
Set display options (optional)
Several options affect what is displayed after analysis:
- Show every echo — enables the individual echo spectra in the Echo Spectra tab. Uncheck for sessions with more than about 20 echoes to avoid slow rendering.
- Full X range — shows the spectrum over ±1000 Hz instead of the default ±200 Hz around the echo centre. Useful for checking interference or a broad noise floor.
- dB Y axis — switches the spectrum Y axis to decibels (dB relative to the noise baseline). In this mode the noise floor sits at 0 dB and signal peaks show positive values.
- Save JPG files — saves the SNR history, averaged spectrum, and individual echo spectrum plots as JPEG images in the output directory when Run Analysis is clicked. A CSV results file is always saved regardless of this setting.
Check Advanced Settings (usually not needed)
Click the Advanced Settings tab. The three fields there are normally left blank, in which case all parameters are taken from the WAV file metadata:
- FFT size (NFFT) — spectral resolution. The default (32768) gives approximately 0.37 Hz per bin at the 12 kHz analysis rate. Change only if you have a specific reason.
- Tone override — overrides the echo audio frequency. Leave blank unless you know the metadata value is wrong.
- Width override — overrides the Doppler spreading width used for SNR integration. The field is auto-filled from the first selected file's metadata; you can adjust it here without re-running to explore the effect on SNR.
Run the analysis
Click Run Analysis. A progress bar advances as each file is processed. The log box below shows per-echo SNR results and a summary on completion. When finished, the Averaged Spectrum tab opens automatically.
View the results
Four tabs show the analysis results:
- Averaged Spectrum — the power spectrum averaged coherently across all echoes, with the accumulated SNR shown in the title. The green shaded region is the signal integration band; red-shaded flanks are the noise reference regions.
- SNR History — a scatter plot of per-echo SNR (green dots) and running average (orange line) versus echo number.
- Echo Spectra — individual spectrum plots for each echo, scrollable. Only shown if Show every echo was checked.
- Results Table — full numerical results for every echo: SNR, average SNR, perigee-equivalent SNR, spreading width, echo frequency, moon azimuth and elevation, propagation delay, peak and centroid frequencies, grid locator, and timestamp.
Adjust the display without re-running
The Smooth spinner applies Gaussian smoothing to the spectrum plots. Changing it, or toggling Full X range or dB Y axis, immediately redraws the plots without reprocessing the WAV files.
Output Files
| File | Contents |
|---|---|
batch_snr.csv |
All numerical results for every processed echo. Always written. |
snr_history.jpg |
SNR history plot. Written when Save JPG files is checked. |
averaged_spectrum.jpg |
Averaged echo spectrum. Written when Save JPG files is checked. |
echo_NNN_spectrum.jpg |
Per-echo spectrum plots (one per echo). Written when Save JPG files and Show every echo are both checked. |
Understanding the SNR Values
SNR values are in dB relative to a 2500 Hz noise bandwidth, matching the definition used by EMETest during live measurement. The accumulated average SNR shown in the Averaged Spectrum plot is a power-domain accumulation across all echoes — the statistically most efficient estimator. The perigee-equivalent SNR corrects the average for moon distance at the time of the session so that comparisons across different sessions are on a common basis. The SEM (standard error of the mean) gives an indication of measurement uncertainty.