.jpg)
WSJTX v 2.6.1 Echo Mode - A Basic Guide
Note: Reports of the results of echo testing are welcome and can be entered via https://www.formpl.us/ or sent to me via email (my callsign @ hotmail.com)
WSJTX v2.6.1 is now in general release and contains a new echo mode which operates differently from the echo mode found in earlier general releases of WSJTX. It gives more accurate estimates of echo strength (especially on signals with wide spreading) and adds some new features. Echo testing is a very valuable tool for measuring the performance of an EME system and evaluating the effect of system changes
When using full CAT frequency control and with Doppler mode set to "Own Echo" a 1500Hz tone is transmitted and CAT control adjusts the Rx frequency so that the echo is received at a frequency where it appears as a 1500Hz tone.
However, in addition to this "normal" echo mode, the new echo software can be used in a way where a combination of RIT and audio frequency shifting is used to track the Doppler shift of the echo. The audio frequency tracking has a range of +/- 750Hz, so if the Doppler shift is less than that, no CAT control or RIT is required. The program knows what the Doppler shift should be and so uses that number to audio shift the received echo and move it to 1500Hz on the echo graph. If the Doppler shift is greater than +/- 750Hz, RIT can be used to bring it down into the +/- 750Hz range. So, for example, if the Doppler shift is 2314Hz, you can use 2300Hz of RIT and the program will then use addition audio shifting (in this example by 14Hz). With 2300Hz of RIT, the program will now maintain the echo at 1500Hz on the echo graph as long as the total Doppler shift is between 3050Hz and 1550Hz without requiring CAT based Doppler control. The audio frequency shifting technique is also used to maintain the echo at 1500Hz, even when CAT controlled frequency tracking is made in steps of greater than 1Hz.
Echo Mode User Interface
The control options are:
- STOP - stops the monitoring mode
- MONITOR - continuously looks at the incoming audio stream and reports an average signal strength (useful for measuring Sun Noise for example)
- ERASE - erases the data from the display
- CLEAR AVERAGE - zeros the accumulator which adds and averages the signals to date
- AVG - The size of the average buffer. Averaging is taken over the last "N" echoes, so it's a sliding average.
- DECODE - This has no function in echo mode.
- ENABLE TX - Starts and echo sequence. Also clear the average before starting to receive
- HALT TX - stops and echo sequence
- TUNE - Sends a 1500Hz tone. Click again to stop tone.
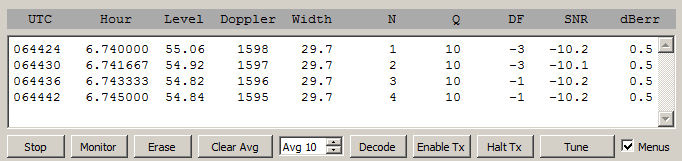
The data is displayed in the following columns:
- UTC - The time in UTC (HMS)
- HOUR - The UTC HMS time in decimal format (hours). This number more convenient for data plotting then time in HMS format
- LEVEL - The strength of the audio signal integrated across the audio passband. The numbers are similar to the audio "thermometer" scale but has higher resolution and a longer integration time.
- DOPPLER - The calculated Doppler shift of the echo. Same as shown in the Astronomical window
- WIDTH - The calculated (not measured) with of the echo. Same as shown in Astronomical window
- N - The number of accumulated Rx periods (echoes or continuous monitoring segments)
- Q - A measure of confidence that a real echo has been detected. 0-10 scale. For very weak signals, anything consistently much above a 1 or 2 probably means you have a real echo if the SNR is stable. You should also be seeing a visible peak on the echo graph to confirm the result.
- DF - The difference between the measured echo frequency and the expected (1500Hz) frequency. This should be a small, single digit number.
- SNR - The signal to noise ratio for echoes
- dBerr - The variance in the measured SNR. The lower the better. 0.5 is the minimum (best SNR value)
The Echo Graph
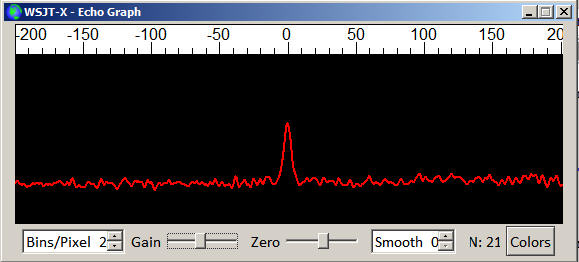
Echo plot after 21 echoes at an SNR of -23dB
The Echo Graph shows the accumulated frequency spectrum of the received echo. Assuming you are correctly Doppler tracking you are looking for a peak at 1500Hz when you are echo testing. The new audio shift interpolation between CAT steps should mean that the peak will now not be distorted when 10Hz or 20Hz frequency steps are used, as was the case in previous versions of echo mode.
As documented below, SNR numbers will change over the first few echoes. The stronger the echo SNR, the fewer echoes will be needed before a steady state is reached. If the echo numbers have reached a constant value, you will also probably see dBerr drop to a low number (0.5) and Q to to a high number 10. Those parameters then indicate a good SNR estimation. For weak signals (say -23 or -24dB), it may take 20 or 30 echoes before things stabilize, for strong echoes (say -15 or better) it may take only 5 to 10 echoes. The first few echo SNR values may not be representative of the average, so don't give them much weight. Due to the nature of EME echoes, an individual echo maybe be 3dB or more above or below the average echo SNR. Weaker, broader, echoes will take longer to reach a steady SNR value.
The average is a sliding average, i.e. the average over the last "N" echoes and "N" can be set by the user. With strong signals and a low value for N, this can be be useful for "peaking" echoes. Normally, if you are just taking an echo reading, you probably want to set this number to maybe 30 or 40, so that the average value has time to stabilize when echoes are weak.
Using the new Echo Mode
Here are some step by step instructions on using the new echo mode with and without CAT frequency tracking and with and without using RIT RX frequency control.
1 - Echoes using normal CAT frequency control
- "Doppler Tracking" in the astronomical window should be checked
- Change Mode to "echo"
- Doppler Tracking should default to "Own Echo". If it doesn't, select "Own Echo"
- To clear the data window click on "Erase". Starting a new echo sequence should automatically clear the average.
- Click on "Tx Enable" to start a series of echoes.
- You should see data appear in the main windows and a peak should start to grow at 1500Hz in the Echo Graph window
- When SNR reaches a steady value and/or dBerr is less than 1 and/or Q is greater than zero and you have at east 5 or 6 echoes, you can click on "Halt Tx"
The SNR should now be reading your average signal to noise ratio (calculated in a 2500Hz bandwidth). To repeat the process go back to step #4.
Echoes using RIT - CAT not required
- "Doppler Tracking" in the astronomical window should be checked
- Change mode to "echo"
- Doppler Tracking will default to "Own Echo". Change this to "none"
- Read the value of "SelfDop" (self Doppler) from the Astronomical window and enter this value (or something close to it) in the RIT windows in the "echo mode" section of the Astronomical window. If "SelfDop" is +2136, you can enter +2100 or +2200 and everything will be fine. If the value of "SelfDop" is larger than the maximum RIT value you can set, then you can't use this method. You may have to wit for a time when "SefDop" is within your RIT range.
- Set the RIT on your rig to the value you entered in the RIT box in the Astronomical Window.
- To clear the data window click on "Erase". Starting a new echo sequence should automatically clear the average.
- Click on "Tx Enable" to start a series of echoes.
- You should see data appear in the main windows and a peak should start to grow at 1500Hz in the Echo Graph window
- When SNR reaches a steady value and/or dBerr is less than 1 and/or Q is greater than zero and you have at east 5 or 6 echoes, you can click on "Halt Tx"
The SNR should now be reading your average signal to noise ratio (calculated in a 2500Hz bandwidth). To repeat the process go back to step #4.
Echoes when "Selfdop" is between +750 and -750Hz. Neither RIT nor CAT is required
- "Doppler Tracking" in the astronomical window should be checked
- Change mode to "echo"
- Doppler Tracking will default to "Own Echo". Change this to "none"
- Make sure the RIT windows in the "echo mode" section is set to 0Hz
- To clear the data window click on "Erase". Starting a new echo sequence should automatically clear the average.
- Click on "Tx Enable" to start a series of echoes.
- You should see data appear in the main windows and a peak should start to grow at 1500Hz in the Echo Graph window
- When SNR reaches a steady value and/or dBerr is less than 1 and/or Q is greater than zero and you have at east 5 or 6 echoes, you can click on "Halt Tx"
The SNR should now be reading your average signal to noise ratio (calculated in a 2500Hz bandwidth). To repeat the process go back to step #4.
Measuring the SNR of a Dx Carrier
With the new echo mode you can measure the SNR of a DX carrier using pretty much the same steps as you use when measuring your own echo. The differences are:- You must enter the DX station Call and Grid in the boxes in the Main window. The grid should be 6-characters, and the grid you enter for yourself on the setup page should also be 6-characters. For me this would be FN54uj, not just FN54
- The DX station should select "Own Echo" Doppler mode
- You must select "On Dx Echo" as the Doppler mode
- Your and the Dx station need to be very well frequency coordinated, preferably with both stations GPS locked. You should see the Dx carrier appear within a few Hz of 1500Hz on the Echo graph
- The DX station sets TX audio frequency to 1500Hz and sends a carrier by pressing the "tune" button
- You run and collect data in "Monitor" mode. Start monitoring only when you know the DX station has started to transmit. The DX station's SNR will appear in the SNR column
- You can use CAT Doppler tracking or RIT assisted Doppler tracking, just as for your own echoes, but when using RIT assisted tracking you enter the DXDop: value, not the SelfDop: value in the Echo Mode RIT value box in the Astronomical window.
Measuring Noise
You can measure noise with the new echo mode, provided that your receiver is operating in a linear region (e.g. with AGC off). This can be useful when measuring sun noise or ground noise (or even moon noise if you have a big enough dish and a high enough frequency to actually see moon noise). The procedure for this is simple.
- Select "Monitor"
- The "level" column of the display will give you the audio noise level averaged across the receiver audio passband, averaged over the last few seconds.
- Only the time and level columns contain useful data. You can ignore the other columns.
Saving Data
Note that if you select "Save all" from the main "Save" menu, each echo will be saved as a separate .wav file, and these .wav files can be played back in the normal way via the File -> Open menu selection. Note that if you have Save all selected, files will be written every 3 seconds while in monitor mode, so if you don't want to fill the disk, don't leave "save all" selected while in monitor mode unless you actually want to save that data.Note that when using echo mode, all the data that appears in the main window is saved to a file "all_echo.txt" which is in the WSJTX log directory (File->Open Log Directory)
Dither
There's a "Dither" checkbox in the astronomical window. If checked this adds a slight pseudo random small frequency offset to the transmitted signal (normally fixed at 1500Hz) and the echo is corrected for that frequency offset on receive to bring it back to 1500Hz. This results in all the echo signals adding up on top of each other but it spreads out any narrow local birdie signals. This could possibly assist in the visual identifying a weak echo with low spreading in the presence of birdies. It is normally unchecked and should make no difference to the numbers calculated by WSJTX.
An Example
Here's an example of and echo test on 1296MHz using a combination of RIT and audio tracking. The astronomiscal windows shows the Doppler was 3130Hz at the time of this test and you can see that "none" was selected for the Doppler tracking mode and a RIT offset of 3150Hz was entered (in both the astronomical window and on the rig in use).
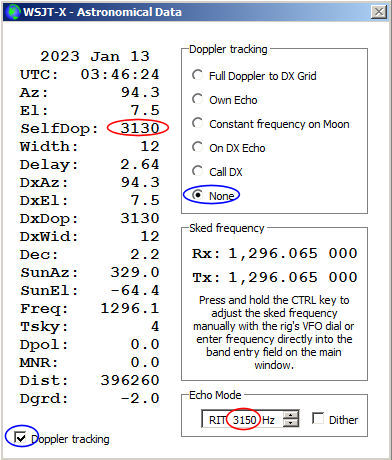
The band used was 1296MHz, Tx power was about 20W at the feed and the antenna was a 3.1m dish. Moon elevation was only 7.5 degrees, so there was still some ground noise pickup which would lower the echo SNR a little over what might be expected when the moon was higher.
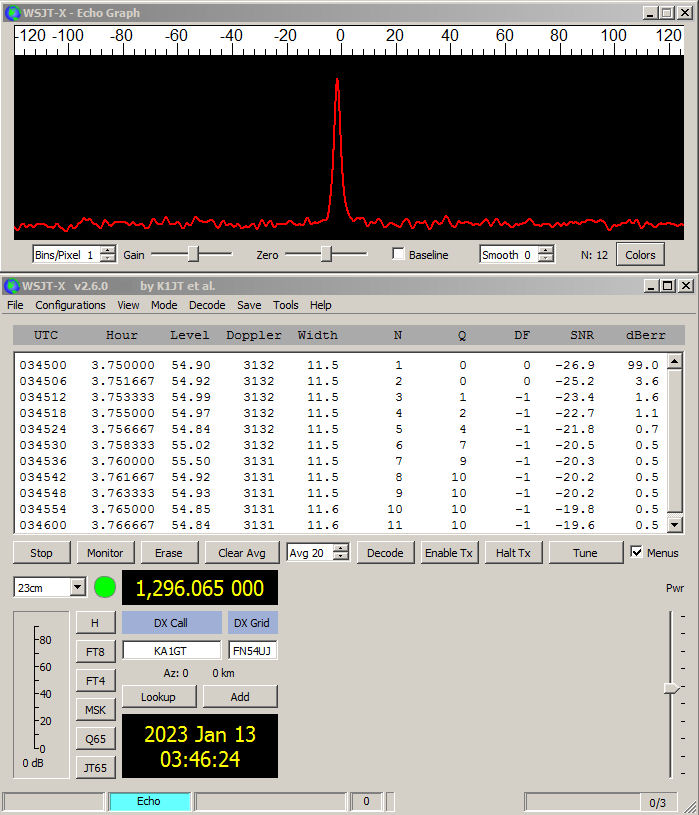
You can see that as readings are averaged, dBerr goes down, Q goes up and SNR stabilizes at around -20dB. DF showed the echo was within 1Hz of the nominal 1500Hz tone.
You can estimate your expected echo strength using EMECalc. The EMECalc numbers are probably the very best you could expect. Most station will see echoes a few dB weaker then the theoretical prediction since most stations aren't operating with perfect equipment under perfect conditions! On 144 and 432MHz, Faraday rotation effects can lower echo strength by more than 10dB under unfavorable conditions. On 1296MHz and up, Faraday rotation isn't a factor and/or circular polarization is often used. Higher noise levels on the lower bands will also reduce the SNR of echoes.
References and Additional Reading
- See the WSJTX 2.6.1 (and up) user manual (a local copy of which is installed along with WSJTX). Echo mode is described in section 8.6
- EME echoes A longer article dealing with more technical aspects of echo testing and comments about earlier revisions.
- Echo Mode in WSJT-X 2.6.1. Bob Atkins, KA1GT, Charlie Suckling, DL3WDG, and Joe Taylor, K1JT (Dubus, 4/2022, pp. 59-66)
- For more about the relationship between best Tx performance, best Rx performance, best echo performance, dish f/d and feed type see Dish Feed Optimization
- RADAR OBSERVATIONS OF THE MOON J. V. Evans Lincoln Laboratoryl, Massachusetts Institute of Technology, Lexington, Mass.
Acknowledgments
Thanks to Charlie Suckling (DL3WDG) for assistance with writing this guide to the WSJTX 2.6.1 echo mode and of course to Joe Taylor (K1JT) for advice and all his work in developing and implementing the new mode in WSJTX.Note: Reports of the results of echo testing are welcome and can be entered via https://www.formpl.us/ or sent to me via email (my callsign @ hotmail.com)