
Modulation Transfer Function (MTF) and Subjective Quality Factor (SQF)
Introduction
When it comes to image quality the lens stands as the first, and possibly most important, link in the chain. Without a sharp lens it's not possible to get a sharp image. However to determine if a lens is sharp, and how sharp it is, we need some sort of objective scientific test method which we can apply equally to all lenses. The "gold standard" test for many years has been the determination of MTF or Modulation Transfer Function. This sounds complex but really it isn't. It's simply a measure of how much of the modulation (contrast) in an object appears in the image of that object as produced by the lens under test.
Modulation Transfer Function (MTF)
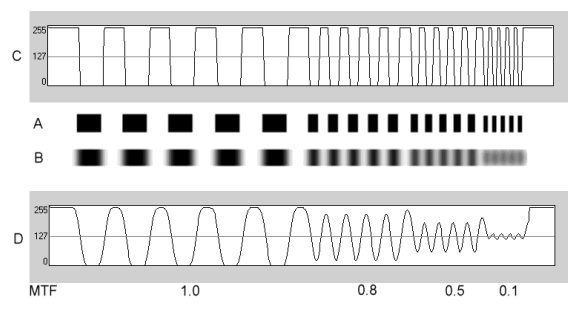
MTF is probably best explained using the image below. At "A" we see a set of patterns of dark and light bars. There are 4 sets of bars at increasing small spacings. At "C" we see a line profile of "A", which is basically a plot of the intensity across "A" where the white areas have an intensity of 255 and the black areas have an intensity of 0. (255 is the maximum intensity of an 8-bit digital image).
At "B" we see what the image of those bars might look like when they are imaged by a lens. The dark and light regions blur, and the closer the spacing they more blurred they become. At "D" we see the line profile and below the plot is the MTF that would be calculated from that data.

MTF is defined as
MTF = (max intensity - min intensity)/(max intensity + min intensity)
The important point to note here is that the blurring of the image isn't necessarily due to any defect in the lens. Even a perfect lens does this because of diffraction. Diffraction is the tendency for light to spread out when forced through an aperture. This results in some of the light from the light areas spreading into the dark areas. When the light and dark areas are large, this doesn't have a big effect (the MTF is still quite high), but when the dark and light areas are small even a small amount of light spread causes a significant drop in MTF. The result of this is a lowering of the MTF as spatial frequency increases even for a perfect lens. Of course the degree of blurring can be worse in the presence of lens aberrations. "Spatial Frequency" is the scientific term used to describe the spacing of elements in a pattern.
Getting technical
Strictly speaking when we speak of the MTF of a lens, we have to define the type of test pattern being used. The best pattern from the viewpoint of strict scientific analysis isn't a step pattern as shown above where the elements are black and white bars. The preferred pattern is called a sine wave pattern where the optical density varies between black and white smoothly and the line profile looks like a sine wave. However such patterns are difficult to make and the image of such patterns is hard to measure by eye, so most often a bar type pattern is used. Bar patterns actually yield a slightly higher MTF measurement than sine wave patterns, but the difference is small.
When plotting MTF as a function of the pattern spacing, for a bar pattern the horizontal axis is in units of line pairs per mm while for a sine wave pattern the horizontal axis is in units of cycles per mm, but often this distinction is overlooked. You may see labels such as "lines per mm" or "line pairs/mm". Note that lines/mm and line pairs/mm are normally the same thing. In the former case you count only the black or white lines. In the latter case you count black/white line pairs.
In addition to the type of test pattern, both the light used to illuminate it and the type of detector used to record the image also influence MTF. This is because MTF depends on the wavelength of the light used. Using blue light gives a higher MTF than using red light for example. Normally white light is used, but even then there would be a difference between illumination by daylight and illumination by tungsten light. Tungsten light has a stronger long wavelength component (red light component) than daylight, so MTF measured under tungsten light would be expected to be lower than MTF measured in daylight. The detector can matter because if it's more sensitive to blue light than red light it may yield a higher MTF than if it's more sensitive to red light than blue light.
USAF 1951 Test Pattern


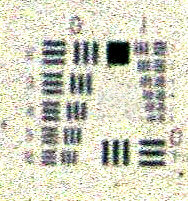
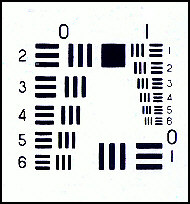
A pattern that has historically been frequently used to make MTF and resolution measurements is the USAF 1951 pattern shown above. It was developed by the US Air Force (in 1951), hence the name! Above on the right is the pattern itself and on the left is an image of the pattern on film. By measuring the results on film you can compare lenses, but you can't easily determin lens MTF since the film will itself limit resolution and lower the system MTF. However you can, with the right equipment, measure the characteristics of the aerial image formed by the lens and thus directly measure the lens MTF.
[NEXT: Measuring MTF - Slit Functions and Fourier Transforms]
